Blackbox Explorer MinMax control
The MinMax control feature can control curves scale and placement quickly and full.
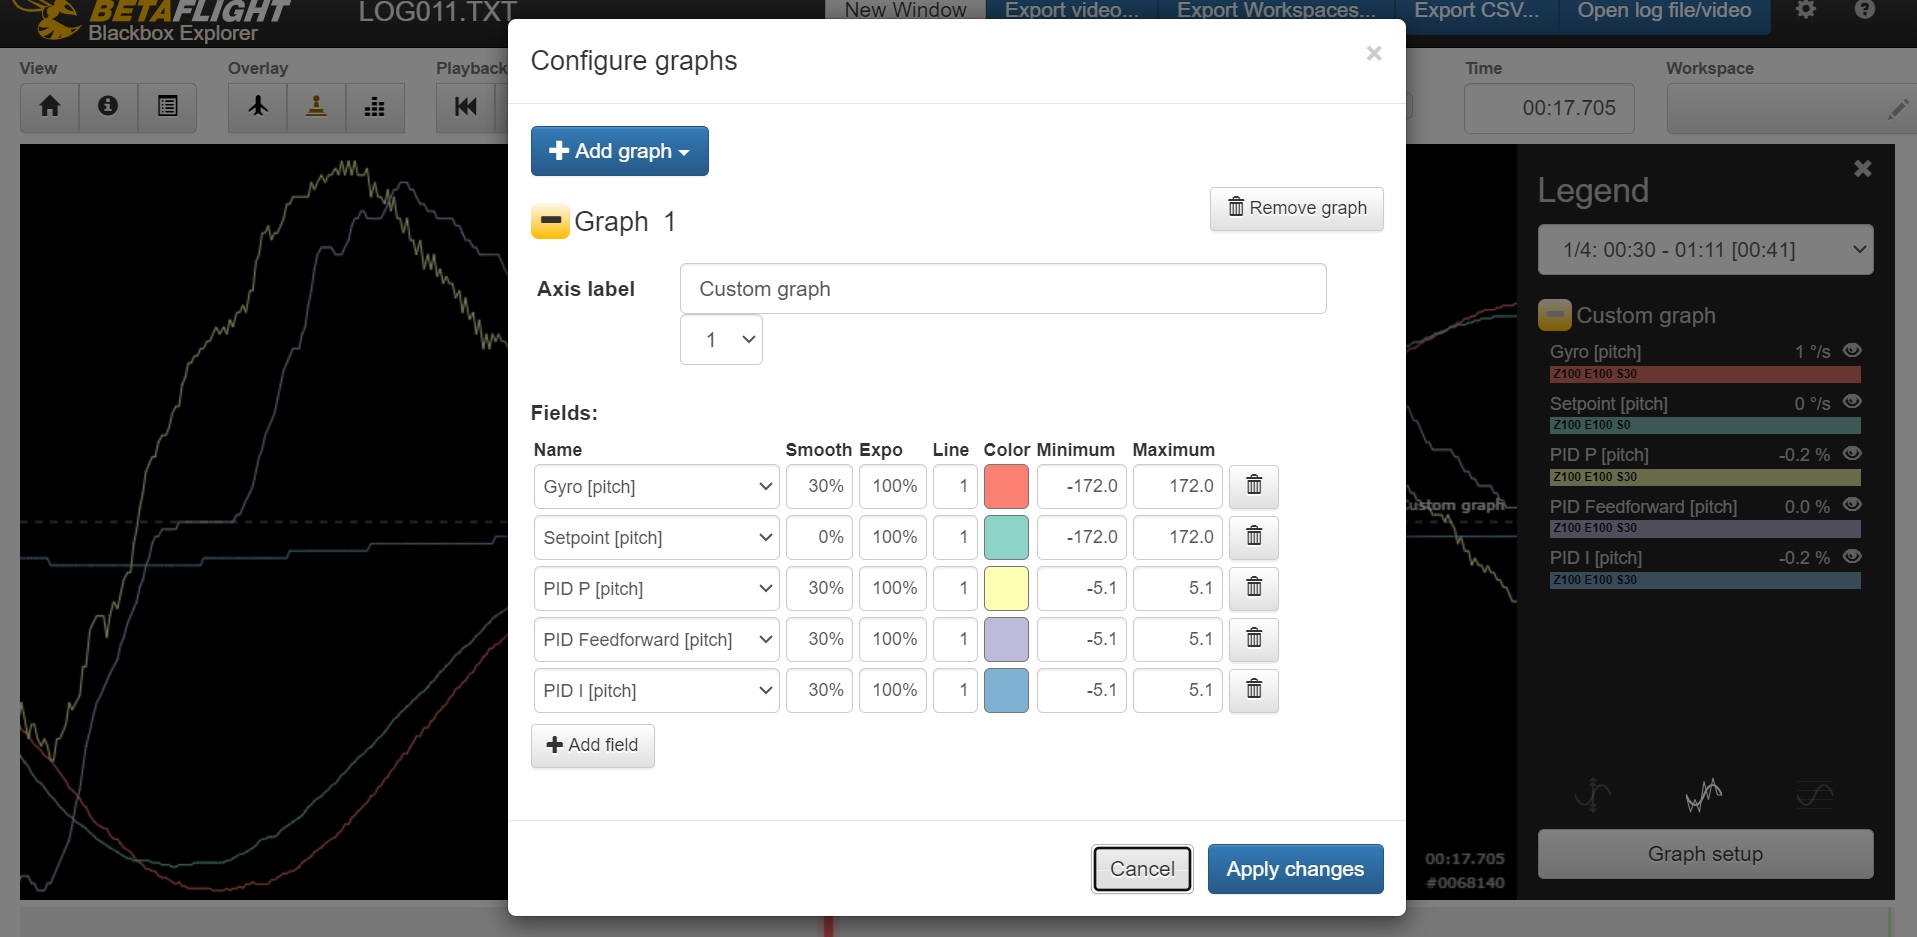
The current MinMax curves settings are showed at 'Configure graphs' dialog box in the "Minimum" and "Maximum" columns.
 The MinMax values can be changed:
- By direct input into table cells at 'Configure graphs' dialog box. It is possible to changes values manualy or set default values by double mouse click at values field.
- By using context menu
To show context menu you must do right mouse click on Minimum or Maximum values field what you want to edit.
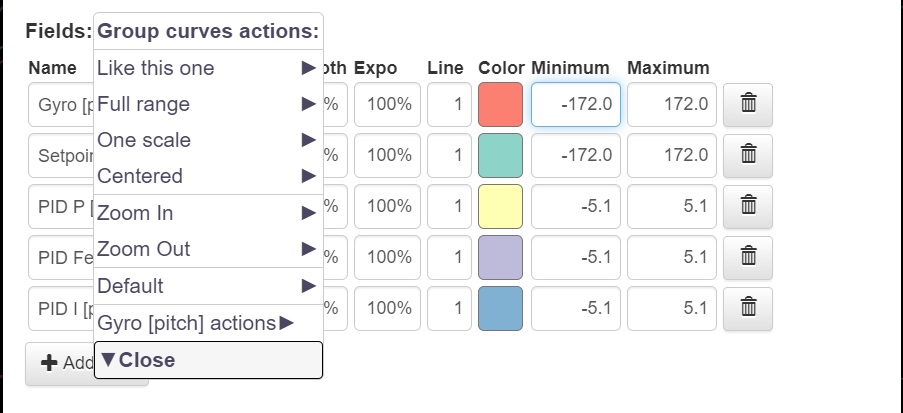
The main context menu:
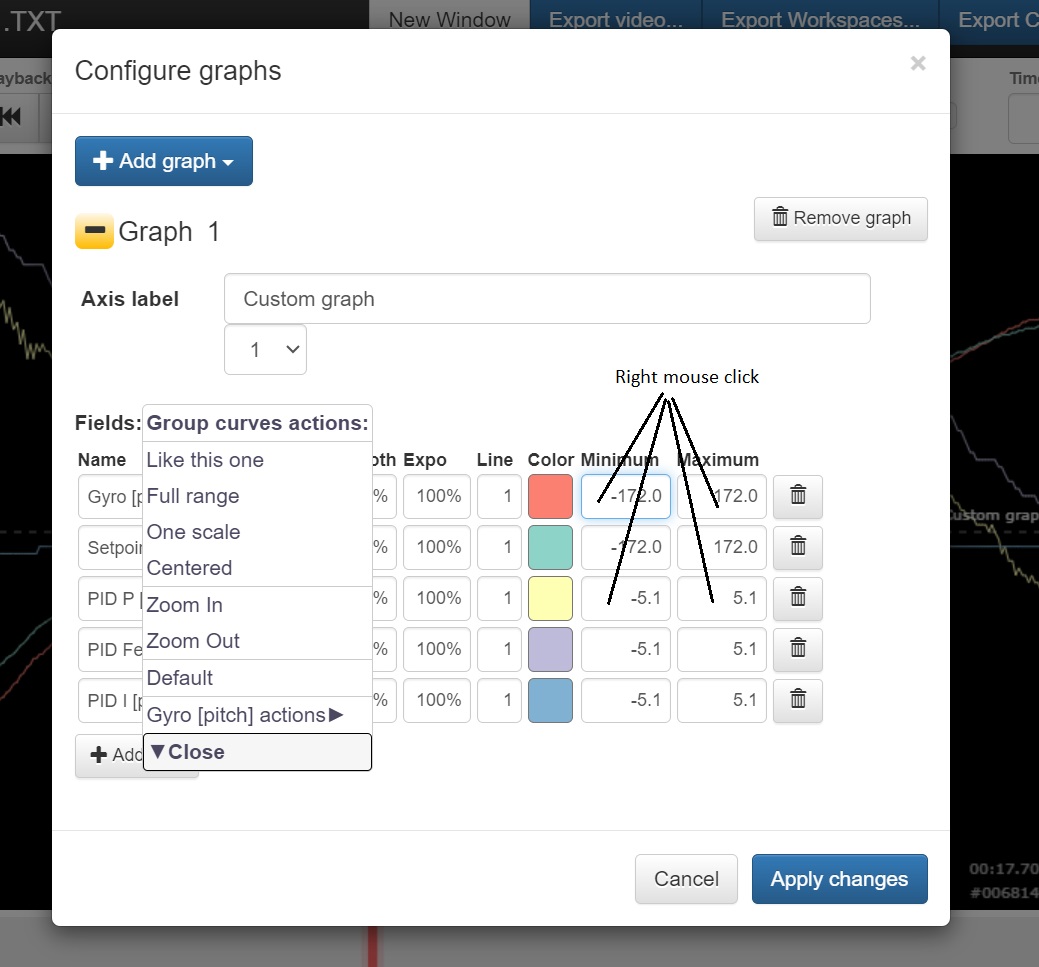
Main menu
The main menu include following parts:
- The menu actions to edit all curves
- The menu actions to edit one curves what you selected by right mouse click (The 'Gyro pitch' for example at the picture)
- The extended mode
Actions
- 'Like this one' - apply MinMax of curve what you selected by right mouse click ('Gyro pitch' for example) to all curves.
- 'Full range' - set the all curves MinMax values from Log file data during the all flight time
- 'One scale' - set all curves to one scale
- 'Centered' - The curves are centered around X-axis
- 'Zoom in', 'Zoom out' - change zoom for all curves
- 'Default' - set the all curves MinMax values to default
Single curve submenu
The single curve submenu has same actions:
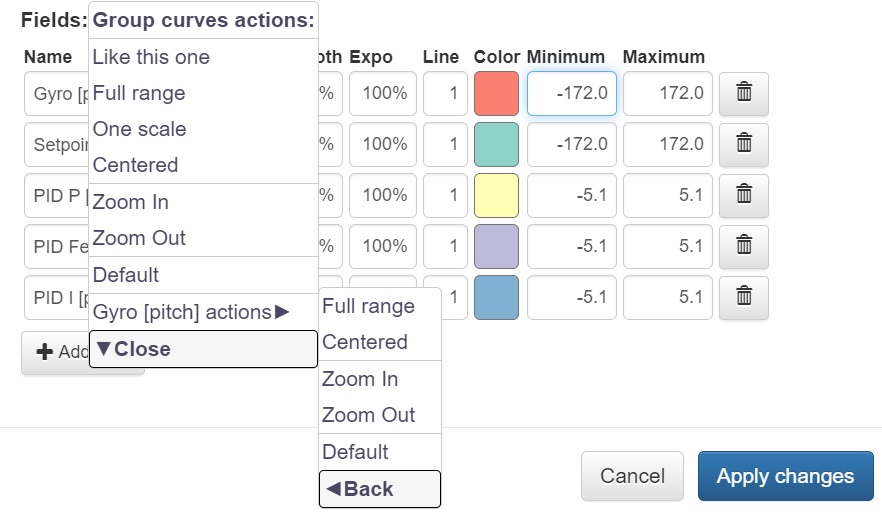
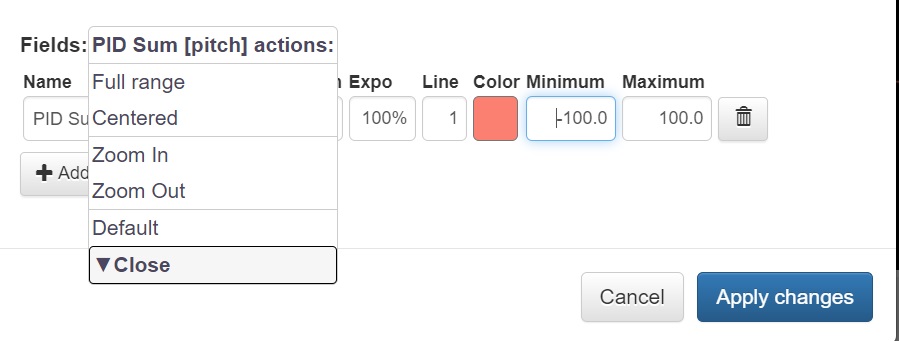
Contect menu
If you open context menu for one curves chart, then you see the short menu:
Extended Mode
The main menu has extended mode. You need press the 'Shift' key to activate it and select the submenu, what you need.
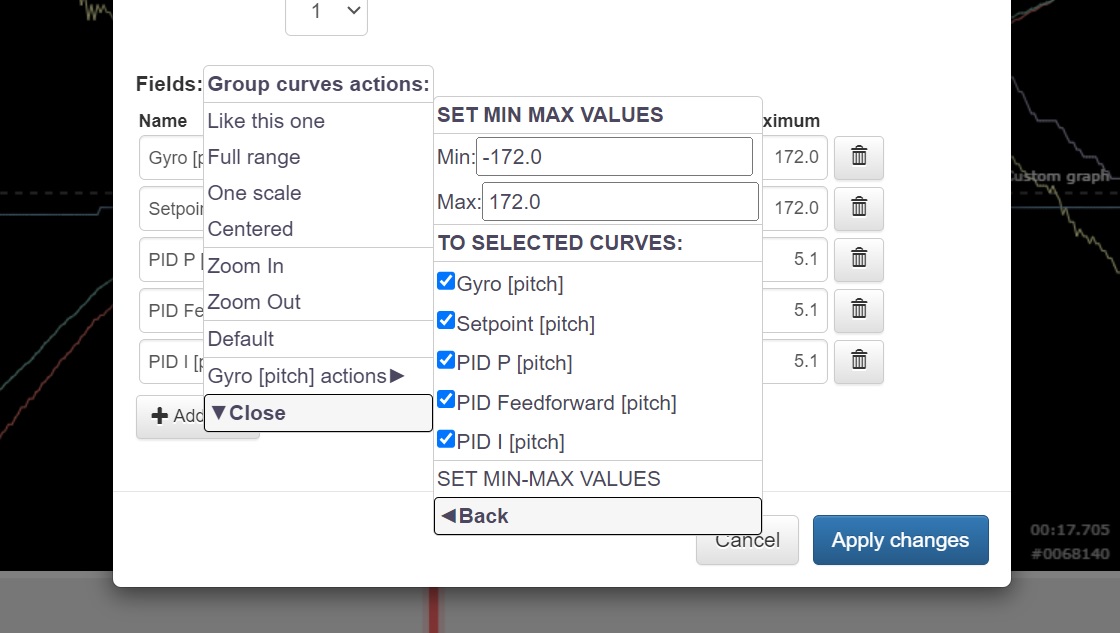
The 'Like this one' extended submenu.
You can change MinMax values and select curves what you need by using the checkboxes to apply these values.
Click 'SET MIN-MAX VALUES' item for apply.
Click 'Back' menu item to go back to main menu or click 'Close' menu item to close it.
Click 'Apply change' or 'Cancel' button on the main 'Configure graphs' dialog box to close the menu and dialog box immediately
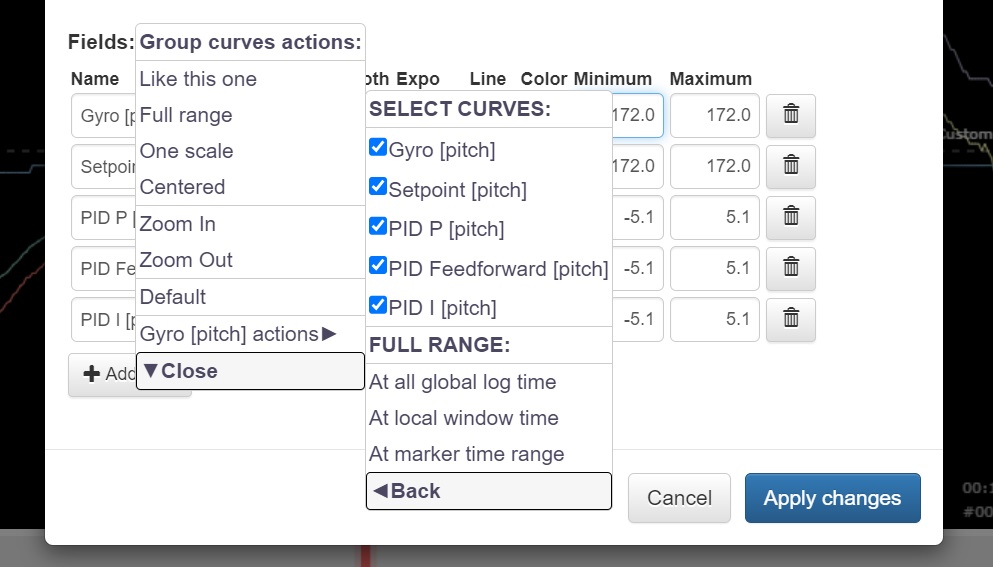
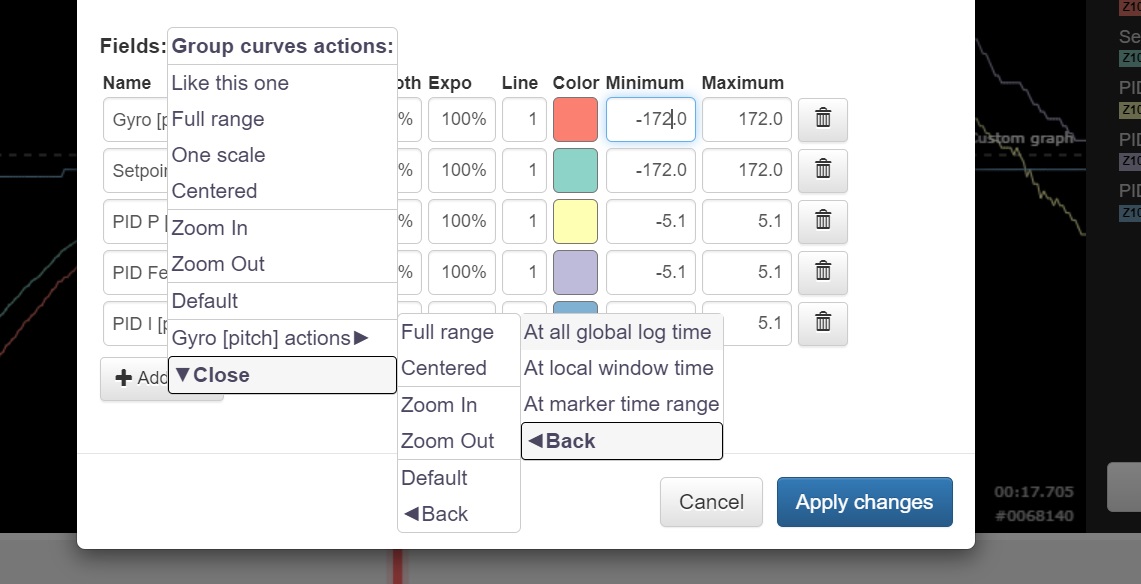
The 'Full range' extended submenu.
You can select curves what you need by using the checkboxes to apply values.
Click 'At all global log time' menu item to set MinMax values from log data during all time.
Click 'At local window time' menu item to set MinMax values from current time interval at the chart window.
Click 'At markere time range' menu item to set MinMax values from markered time interval what you select by using "I", "O" keys. If it is not select then will apply all log time interval.
Click 'Back' menu item to go back to main menu or click 'Close' menu item to close it.
Click 'Apply change' or 'Cancel' button on the main 'Configure graphs' dialog box to close the menu and dialog box immediately
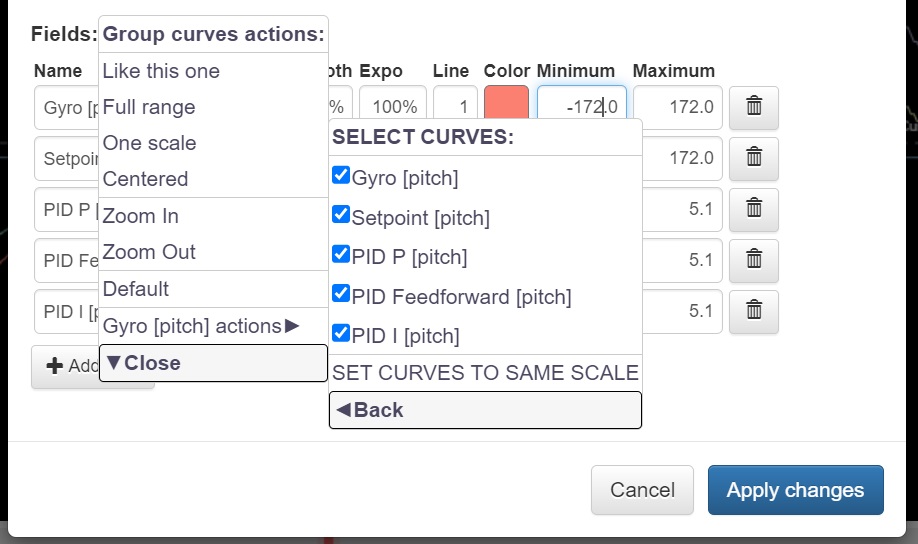
The 'One scale' extended submenu.
You can select curves what you need by using the checkboxes to set the same scale.
Click 'SET SET CURVES TO SAME SCALE' item for apply
Click 'Back' menu item to go back to main menu or click 'Close' menu item to close it.
Click 'Apply change' or 'Cancel' button on the main 'Configure graphs' dialog box to close the menu and dialog box immediately
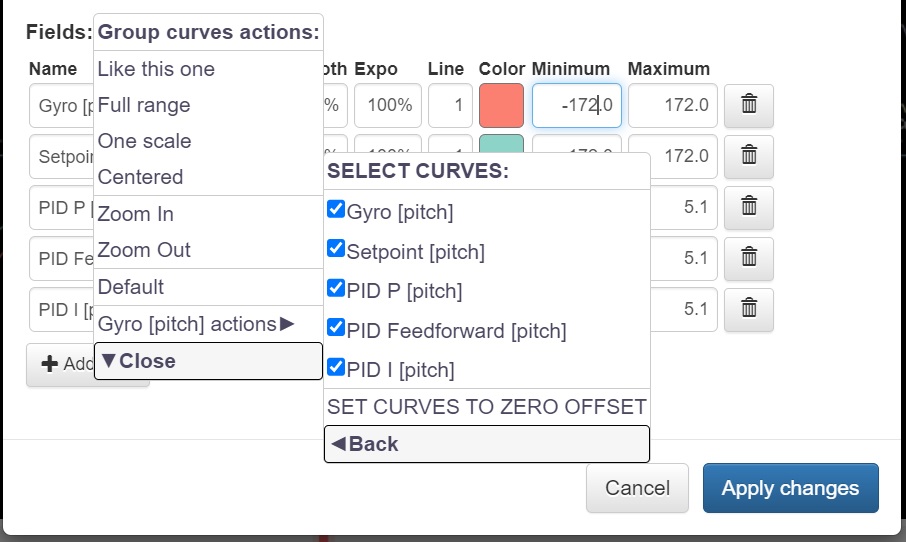
The 'Centered' extended submenu.
You can select curves what you need by using the checkboxes to centered.
Click 'SET CURVES TO ZERO OFFSET' item for apply
Click 'Back' menu item to go back to main menu or click 'Close' menu item to close it.
Click 'Apply change' or 'Cancel' button on the main 'Configure graphs' dialog box to close the menu and dialog box immediately
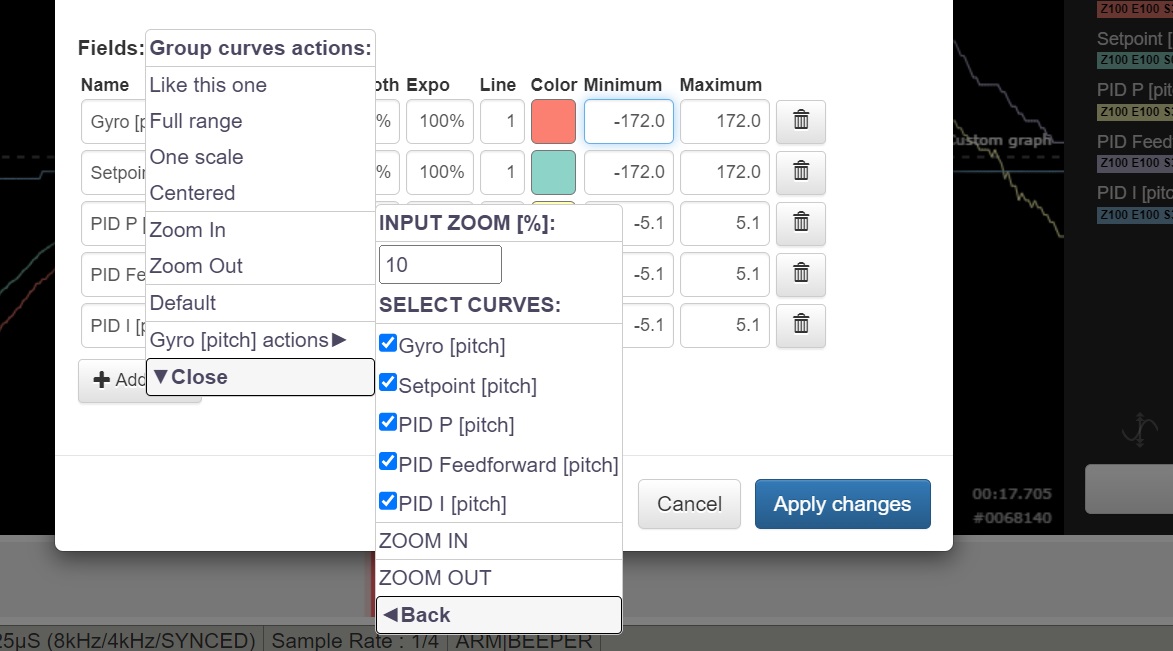
The 'Zoom in', 'Zoom out' extended submenu.
You can set the zoom procent value and select curves what you need by using the checkboxes to apply zoom.
Click 'ZOOM IN', 'ZOOM OUT' items for apply zoom
Click 'Back' menu item to go back to main menu or click 'Close' menu item to close it.
Click 'Apply change' or 'Cancel' button on the main 'Configure graphs' dialog box to close the menu and dialog box immediately
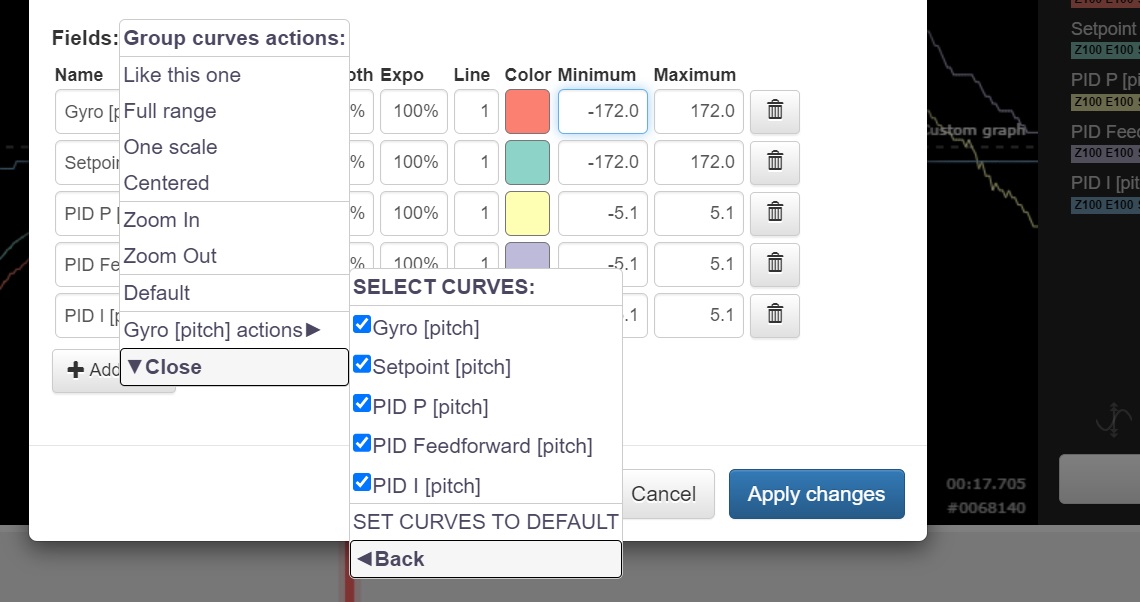
The 'Default' extended submenu.
You can select curves what you need by using the checkboxes to apply default values.
Click 'SET CURVES TO DEFAULT' item for apply
Click 'Back' menu item to go back to main menu or click 'Close' menu item to close it.
Click 'Apply change' or 'Cancel' button on the main 'Configure graphs' dialog box to close the menu and dialog box immediately
The single curve submenu has one 'Full range' extended item:
It is like 'Full range' extended submenu, but for one selected curve only.
The examples of using curves MinMax control
- If you know what curves MinMax values you need, then you can set it directly in MinMax input fields, open main menu and apply 'Like this one' action to set it for the all curves. Also, you can use extended 'Like this one' submenu to set different MinMax for selected curves.
- You can use the 'Full range' main menu item or extended submenu to auto set MinMax for selected time range. Then you can use 'Centered' and 'One scale' actions to auto format values.
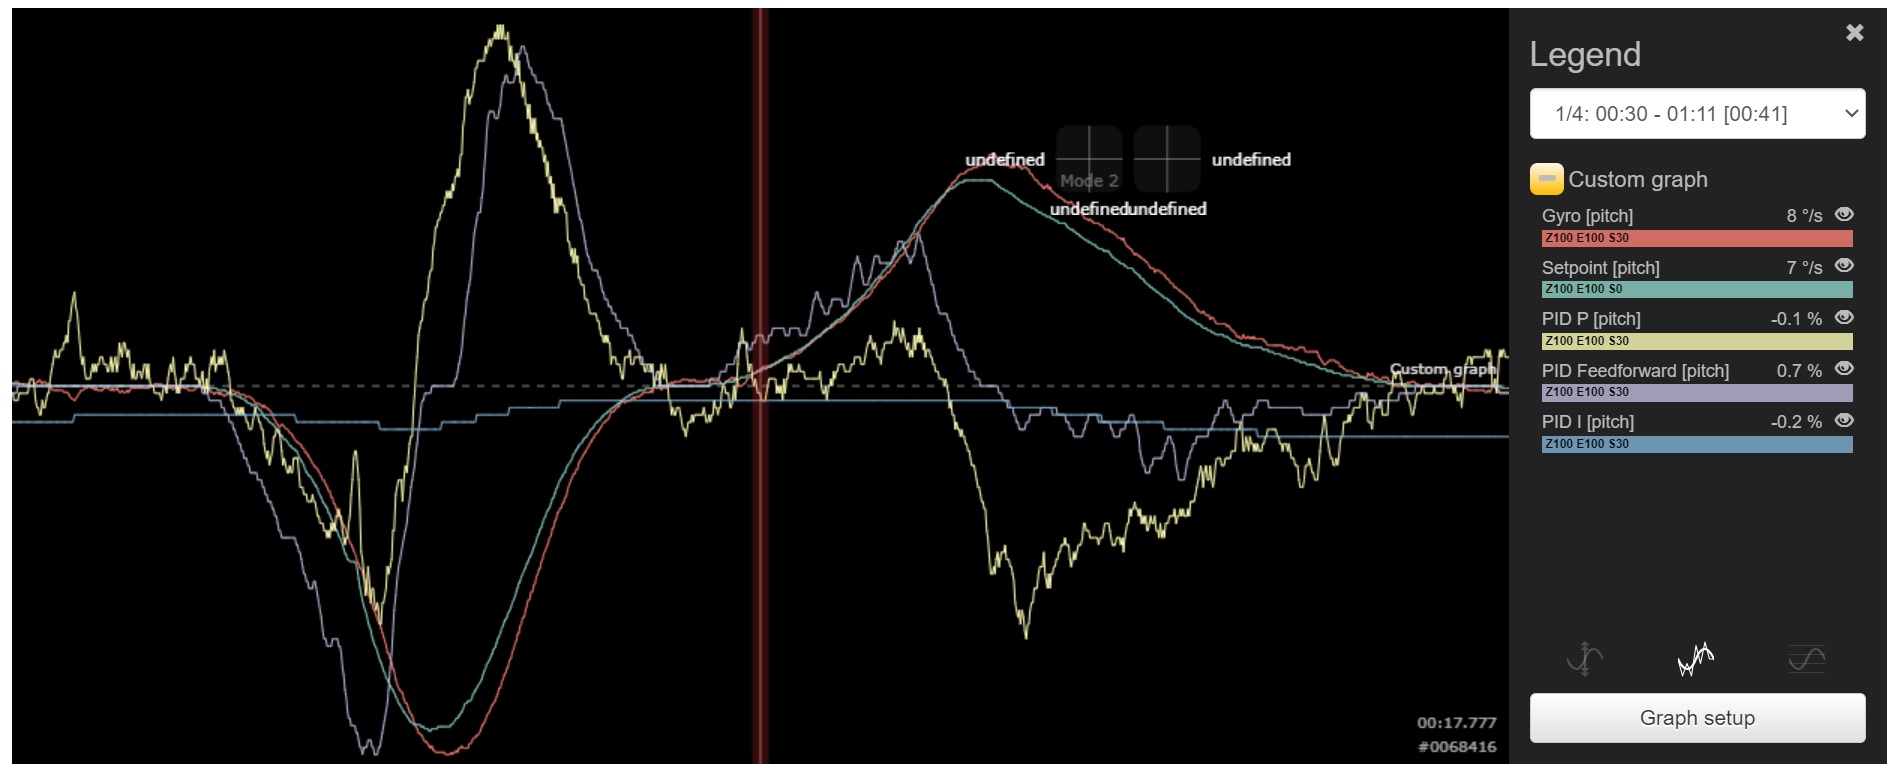
At this picture the Gyro and Setpoint are set to one full range scale and the PID values are in the other own full range scale.
The all are centered.